Petrochemicals
- Sales down by €2,104 million to €5,728 million due to price declines
- Earnings slightly below prior-year level due to higher fixed costs, with improved margins
Sales to third parties decreased in the Petrochemicals division by €2,104 million to €5,728 million in 2015, mostly because of a sharp drop in sales prices (volumes –4%, prices –25%, portfolio –4%, currencies 6%). This development was largely the result of the sharp decrease in raw material prices since the fourth quarter of 2014, especially for naphtha. Sales were furthermore diminished by the consequences of a production outage at the Ellba C.V. joint operation at the Moerdijk, Netherlands, site since June 2014 as well as the divestiture of our shares in the Singapore-based Ellba Eastern Private Ltd. joint operation at the end of 2014. In North America, higher prices for condensate led to reduced capacity utilization of the condensate splitter and therefore to lower sales volumes. Currency effects, however, were overall positive.
For steam cracker products as well as ethylene oxide and glycols, we saw good margin development in the first half of 2015 in both Europe and North America as a result of market scarcity. As the second half of the year progressed, margins weakened perceptibly as product availability on the market increased. In the industrial petrochemicals business, margins improved for solvents and plasticizers in Europe, and for solvents and acrylic monomers in North America. The startup of new plants led to higher fixed costs overall. As a result, income from operations before special items remained slightly below the high level of 2014, despite improved margins overall.
Our new acrylic acid complex in Camaçari, Brazil, began operations in the second quarter of 2015 with an annual capacity of 160,000 metric tons. In October, we started up an isononanol plant in a joint venture with Sinopec in Maoming, China, with a capacity of 180,000 metric tons a year.
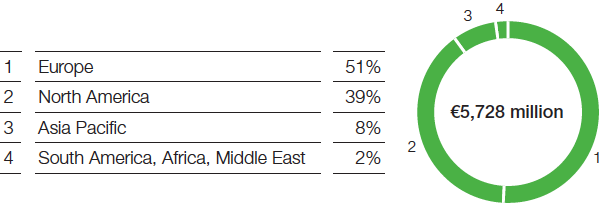
Petrochemicals – Sales by region (Location of customer)