Energy and Climate Protection

As an energy-intensive company, we take responsibility for the efficient use of energy and global climate protection. We are committed to the Paris Climate Agreement. Our products and solutions enable a reduction in greenhouse gas emissions in many areas. At the same time, we are working to significantly reduce our own carbon footprint.
At a glance
18.4 million metric tons
Greenhouse gas emissions1
2.3 TWh
Renewable electricity
- Corporate and Product Carbon Footprints create transparency
- Ambitious emission reduction targets
- Net Zero Accelerator unit bundles and accelerates projects
- Supplier CO2 Management Program
Strategy and governance
Climate protection is very important to us and is an important part of our corporate strategy. We are pursuing ambitious climate protection targets (see “Global targets”), which we aim to achieve with comprehensive carbon management. This includes five levers to reduce our greenhouse gas emissions and demand for fossil fuel:
- Grey-to-green: We are increasingly meeting our electricity needs from renewable sources (see “Energy supply”).
- Power-to-steam: In the future, we will increasingly rely on electrical steam generation and in this way, also tap previously unused waste heat potential (see “Energy supply”).
- New technologies: We are developing completely new carbon-free and low-carbon processes and technologies for climate-smart chemistry (see box below).
- Bio-based feedstocks: We are increasingly replacing fossil resources with alternative raw materials (see “Raw Materials”).
- Continuous opex: Our operational excellence activities continually improve the energy and process efficiency of our plants (see “Energy efficiency”).
We only consider external offsetting measures as a temporary stop-gap if our activities do not make the desired contribution to reducing emissions.
By 2030, we plan to invest up to €4 billion to achieve our climate protection targets.
We have established organizational structures to implement our climate protection targets and carbon management activities with even greater focus and speed: The Environmental Protection, Health, Safety and Quality unit in the Corporate Center develops Group-wide guidelines and requirements for collecting emissions and energy data and for energy management. It conducts regular audits to monitor the implementation of and compliance with internal guidelines and legal requirements by our sites and Group companies. The Corporate Strategy & Sustainability unit develops and tracks the BASF Group’s climate targets and strategic levers for achieving them based on our corporate carbon footprint. The Net Zero Accelerator unit, which was established in early 2022, focuses on the accelerated implementation of existing and new cross-divisional projects to reduce emissions. The emphasis is on carbon-free and low-carbon production technologies, the circular economy and renewable energies (see “Energy supply”). Both Corporate Strategy & Sustainability and Net Zero Accelerator report to the Chairman of the Board of Executive Directors. This integrates climate protection-relevant aspects into strategic decision-making processes and core business activities. In parallel, our operating divisions are working on divisional-specific projects to reduce emissions. They are supported here by the global service units.
We report on greenhouse gas emissions in accordance with the Greenhouse Gas Protocol as well as the sector-specific standard for the chemical industry. We consistently align our actions with our climate protection targets, based on a comprehensive analysis of our emissions. Group-wide CO2 emissions are anchored in the BASF Group’s steering and compensation systems as a most important nonfinancial key performance indicator, giving them even more weight. Steering also includes assessing investments and acquisitions with regard to their impact on our climate protection targets.
We are gradually integrating our suppliers into the management of greenhouse gas emissions along the value chain. To this end, we launched the Supplier CO2 Management Program in 2021 (see “Product Carbon Footprints”).
We offer our customers solutions that help prevent greenhouse gas emissions, and improve energy and resource efficiency. To increase transparency for our customers and target our CO2 reduction measures to those areas where they bring the greatest added value, we continuously determine the Product Carbon Footprint for around 45,000 sales products (see “Product Carbon Footprints”).
We continuously analyze potential risks to our business operations arising in connection with the topics of energy and climate protection and derive appropriate measures. We support the recommendations of the Task Force on Climate-related Financial Disclosures (TCFD). Since the 2019 reporting year, BASF’s annual report has included an overview showing the sections and subsections in which TCFD-relevant information can be found. We also participate in the program established by the international nonprofit organization CDP for reporting on data relevant to climate protection and have done so since 2004. BASF again achieved a score of A– in CDP’s 2022 climate change questionnaire, maintaining its Leadership status. Companies on the Leadership level are distinguished by factors such as the completeness and transparency of their reporting. They also pursue comprehensive approaches in managing the opportunities and risks associated with climate change as well as strategies to achieve company-wide emission reduction goals.
All parts of society must work together to effectively protect the climate. This is why we support various national and international initiatives and are involved in partnerships. For example, in 2022 we provided funding to help the Science Based Targets (SBTi) initiative launch a project to derive science-based climate protection targets for the chemical sector, in which we are also involved as a member of an advisory group. As part of Together for Sustainability, in 2022 we were involved in the creation of a uniform guideline for calculating the carbon footprint of products in the chemical industry (see “Product Carbon Footprints”).
- More information on climate protection and carbon management
- More information on the CDP climate change questionnaire
Global targets
Schematic overview: Development of the BASF Group’s greenhouse gas emissions (Scope 1 and 2)1
Million metric tons of CO2 equivalents

Compared with the 2018 baseline, we want to reduce greenhouse gas emissions from our production sites and our energy purchases by 25% by 2030.1 This means that we aim to reduce greenhouse gas emissions from 21.9 million metric tons to 16.4 million metric tons – despite our growth plans and the construction of a new Verbund site in southern China. This corresponds to a decrease of around 60% compared with 1990. Our long-term goal is net zero greenhouse gas emissions by 2050.1
2030 and 2050 targets
–25%
Reduction in our absolute greenhouse gas emissions by 2030 compared with 2018 (Scope 1 and 2)a
Net zero
Greenhouse gas emissions by 2050 (Scope 1 and 2)a
a BASF operations excluding sale of energy to third parties, including offsetting
The BASF Group’s emissions reported under these targets in 2022 amounted to 18.4 million metric tons of CO2 equivalents (2021: 20.2 million metric tons). The increase in natural gas prices in Europe due to the war in Ukraine, weaker demand due to a slowing economy over the course of the year and several lockdowns in China led to a significant reduction in production volumes and, as a result, emissions in 2022. This particularly affected the emissions-intensive ammonia value chain. The share of electricity from renewable sources was kept roughly constant compared with the previous year and, together with measures to increase energy and process efficiency, made a relevant contribution to reducing emissions.
- More information on climate protection
- A projection of greenhouse gas emissions in 2023 can be found in the forecast
1 Scope 1 and Scope 2 (excluding the sale of energy to third parties, including offsetting). The target includes greenhouse gases according to the Greenhouse Gas Protocol, which are converted into CO2 equivalents (CO2e).
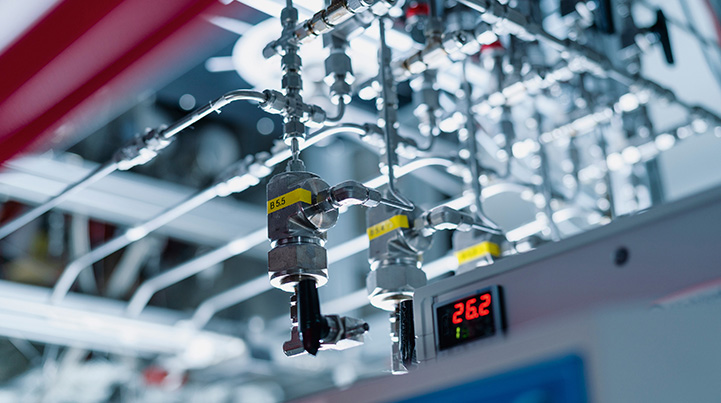
Energy supply
Our total energy consumption was 52.9 million MWh in 2022 (2021: 58.8 million Mwh), significantly below the prior-year figure due to the lower production levels. Total energy consumption includes fuel demand in our own central power and steam generation plants, primary energy requirements in our process plants, and net power and steam imports.
Energy supply of the BASF Group 2022 – electricity supply a

Energy supply of the BASF Group 2022 – steam supply

Fossil fuels and residual fuels used in the BASF Group’s central power and steam generation plants
77.4 %
Natural gas
26.1 million MWh
2.4 %
Heating oil
0.8 million MWh
2.7 %
Coal
0.9 million MWh
17.5 %
Substitute fuels
5.9 million MWh
Total:
33.7 million MWh
To generate our own steam and power, we mainly use natural gas (77.4%) and substitute fuels (17.5%). The latter are residues from chemical production plants that cannot be reused in the BASF Verbund. In 2022, we covered more than 54% of our electricity demand with our own gas and steam turbines in highly efficient combined heat and power plants. Combined heat and power generation reduces the carbon footprint of our energy production and simultaneously ensures that fuels are used as efficiently as possible: For instance, compared with separate methods of generating steam and electricity, we saved 12.0 million MWh of fossil fuels and avoided 2.4 million metric tons of carbon emissions in 2022. To achieve the highest possible energy yield with the lowest possible greenhouse gas emissions, we continuously invest in our combined heat and power plants. In 2022, internally generated power in the BASF Group had a carbon footprint of around 0.25 metric tons of CO2 per MWh of electricity and was below the national grid factor at most BASF sites.
The Verbund system is also key to carbon-optimized energy supply at our sites. It helps us realize synergies and manage value chains in a resource-efficient way. For example, waste heat from one plant’s production process is used as energy in other plants. The Verbund saved us around 19.0 million MWh in 2022, which translates to 3.8 million metric tons less CO2 released into the environment. With combined power and steam generation as well as our continuously optimized Energy Verbund, we were thus able to avoid a total of 6.2 million metric tons of carbon emissions in 2022. That is why we will continue to invest in the creation and optimization of Verbund structures and drive forward the consolidation of production at highly efficient sites.
A core component in reducing our greenhouse gas emissions is the gradual conversion of our energy supply from fossil to renewable sources as part of our carbon management. This mainly affects our electricity supply (grey-to-green lever). In 2022, electricity from renewable sources as a share of total electricity consumption could be kept constant at 16% (2021: 16%). Our electricity requirements will increase significantly in the coming years due to the planned electrification of our steam generation and the gradual switch from natural gas-based to electricity-based, low-carbon production processes, for example in our steam crackers. We aim to source more than 60% of our power needs from renewable sources by 2030. Based on our growth forecast, this is roughly equivalent to our total power demand in 2021.
In the transformation of our power supply, we are pursuing a make & buy approach. Firstly, BASF is investing in its own renewable power assets, particularly offshore wind farms. Secondly, BASF will purchase green power on the market through long-term supply agreements with plant operators, green power agreements or renewable energy certificates, depending on the region and market regulations. A key purchasing criterion is the “additionality” of the electricity purchased. This means that electricity is primarily sourced from new renewable energy facilities.
In 2022, we successfully drove forward the transformation of our power supply. Work on the Hollandse Kust Zuid offshore wind farm, a joint project with Vattenfall and Allianz, is proceeding according to plan. The offshore wind farm should be fully operational in 2023. With 140 turbines and a capacity of 1.5 gigawatts, Hollandse Kust Zuid will then be one of the largest subsidy-free offshore wind farms in the world. Our new solar power plant at the Schwarzheide site in Germany went online at the end of August 2022. We operate it jointly with envia Mitteldeutsche Energie AG (enviaM). Most of the electricity generated (expected electricity production: 25 GWh per year) will be used to supply the Schwarzheide site and cover around 10% of the site’s current annual electricity demand on average.
In addition to these cooperative ventures, in 2022 we concluded further long-term supply agreements for green power. In North America, for example, we have secured around 250 megawatts of wind and solar generation capacity through virtual power purchase agreements with Dawn Solar and EDF Energy Services. BASF has also signed a 12-year supply agreement with X-ELIO to supply 48 megawatts of solar power to the Freeport site in Texas. In China, we initiated further long-term supply agreements for green power with the State Power Investment Corporation and Brookfield, including for our new Verbund site in Zhanjiang, which is currently under construction. Our aim is to supply the site entirely with electricity from renewable sources from the start-up phase of the large-scale plants in 2025 – much earlier than originally planned.
In some regions, we have also acquired green power certificates. The aim is to gradually replace these temporary measures with our own power assets or long-term supply agreements.
In total, over 108 sites worldwide were already partially or fully powered by renewable energy at the end of 2022 (2021: 88). The carbon footprint of purchased electricity in 2022 was around 0.24 metric tons of CO2/MWh (market-based approach), slightly above the previous year’s level (0.21 metric tons CO2/MWh).
The second lever for reducing greenhouse gas emissions in our energy supply starts with the production of steam (power-to-steam lever). In the future, new technologies should make a significant contribution to reducing CO2, for example by recovering energy from the waste heat of our production and infrastructure facilities. To explore the potential of various technologies, in 2022, for example, we initiated a joint feasibility study with MAN Energy Solutions on the construction of an industrial-scale heat pump at the Ludwigshafen site in Germany. This could generate up to 150 metric tons of steam per hour from previously unused wastewater heat, reducing the site’s CO2 emissions by up to 390,000 metric tons per year.
1 Sales product volumes include sales between BASF Group companies; merchandise is not taken into account.
2 Relevant sites are selected based on the amount of primary energy used and local energy prices.
Energy efficiency and specific greenhouse gas emissions
Energy use and greenhouse gas emissions are closely linked to capacity utilization at our plants as well as our product portfolio. Specific greenhouse gas emissions in 2022 amounted to 0.577 metric tons of CO2 equivalents per metric ton of sales product,1 an increase of 2.3% compared with the previous year (2021: 0.564 metric tons of CO2 equivalents per metric ton of sales product). This was mainly due to lower and less uniform capacity utilization at our plants compared with the previous year, which led to reduced plant efficiency. By contrast, the use of renewable energy had a positive impact on specific greenhouse gas emissions.
Since 1990, we have been able to lower our overall greenhouse gas emissions from BASF operations by 54.1% and even reduce specific emissions (per metric ton of sales product) by 74.8%.
|
2022 |
2021 |
2018 (baseline) |
|||||||||||
|---|---|---|---|---|---|---|---|---|---|---|---|---|---|---|
Specific greenhouse gas emissionsa (metric tons of CO2 equivalents per metric ton of sales productb) |
0.577 |
0.564 |
0.577 |
|||||||||||
Primary energy demandc (million MWh) |
54,206 |
57,627 |
60,586 |
|||||||||||
Energy efficiency (kilograms of sales productb per MWh) |
589 |
621 |
626 |
|||||||||||
|
||||||||||||||
As part of our carbon management, we aim to make our plants and processes even more efficient and resource saving (continuous opex lever). Certified energy management systems according to DIN EN ISO 50001 at all relevant production sites2 play a particularly important role here. These help us to identify and implement further potential for improvement in energy efficiency. This not only reduces greenhouse gas emissions and saves valuable energy resources but also increases our competitiveness. In 2022, 76 production sites worldwide had certified energy management systems, representing 87.7% of our primary energy demand.
Certified energy management systems (ISO 50001) at BASF Group sites worldwide, in terms of primary energy demand
%

A global working group provides ongoing support to the sites and Group companies in implementing and maintaining certified energy management systems. All energy efficiency measures are recorded in a global database, analyzed and made available to BASF sites as examples of best practices.
In 2022, we implemented more than 500 measures to reduce energy and resource consumption and increase our competitiveness. At the Chongqing site in China, for example, modifications to the wastewater treatment process reduced heat demand and the resulting emissions by more than 2,500 metric tons of CO2 per year. At a plant at the Kuantan site in Malaysia, an optimized control system allowed existing flash steam to be fully utilized, reducing additional steam demand. This enables an emissions reduction of over 1,500 metric tons of CO2 per year. At the Ludwigshafen site in Germany, the innovative design of a new residue incineration line enables the more efficient use of combustion heat to produce steam. This avoids more than 5,000 metric tons of CO2 emissions every year.
Our employees’ ideas are an important source of optimization. Award-winning suggestions for improvements implemented in 2022 will enable us to save around 9,000 metric tons of CO2 per year at the Ludwigshafen site in Germany alone.
Corporate carbon footprint
BASF has published a comprehensive corporate carbon footprint every year since 2008. This reports on all emissions along the value chain – from raw materials extraction to production and disposal. We are continually working to reduce greenhouse gas emissions both in our own production and, together with our partners, along the value chain (see “Strategy and governance”).
BASF operations |
2022 |
2021 |
2018 (baseline) |
|||||||||||||||||
|---|---|---|---|---|---|---|---|---|---|---|---|---|---|---|---|---|---|---|---|---|
Scope 1b |
|
|
|
|||||||||||||||||
CO2 (carbon dioxide) |
15.434 |
17.234 |
17.025 |
|||||||||||||||||
N2O (nitrous oxide) |
0.306 |
0.418 |
0.677 |
|||||||||||||||||
CH4 (methane) |
0.025 |
0.032c |
0.027 |
|||||||||||||||||
HFC (hydrofluorocarbons) |
0.031 |
0.035c |
0.091 |
|||||||||||||||||
SF6 (sulfur hexafluoride) |
0.001 |
0.001 |
0 |
|||||||||||||||||
Scope 2d |
|
|
|
|||||||||||||||||
CO2 |
2.629 |
2.464 |
4.067 |
|||||||||||||||||
Total |
18.426 |
20.184c |
21.887 |
|||||||||||||||||
Offsetting |
0 |
0 |
0 |
|||||||||||||||||
Total after offsetting |
18.426 |
20.184c |
21.887 |
|||||||||||||||||
Sale of energy to third parties (Scope 1)e |
|
|
|
|||||||||||||||||
CO2 |
0.759 |
0.947 |
0.773 |
|||||||||||||||||
Total |
19.185 |
21.131c |
22.660 |
|||||||||||||||||
Use of biomassf |
|
|
|
|||||||||||||||||
CO2 |
0.084 |
0.091 |
n/a |
|||||||||||||||||
|
||||||||||||||||||||
In 2022, our greenhouse gas emissions according to the Greenhouse Gas Protocol, including Scope 1 and Scope 2 emissions (market-based approach, including sales of energy to third parties) were 19.185 million metric tons of CO2 equivalents (2021: 21.131 million metric tons). Of this amount, 86% were Scope 1 emissions (2021: 88%) and 14% were Scope 2 emissions (2021: 12%). Carbon dioxide was by far the largest component and accounted for 98% of emissions (2021: 98%).
Scope 3 greenhouse gas emissions arising upstream and downstream of our operations in the value chain are calculated in accordance with the Corporate Value Chain (Scope 3) Accounting and Reporting Standard published by the Greenhouse Gas Protocol and the WBCSD Guidance for Accounting and Reporting Corporate GHG Emissions in the Chemical Sector Value Chain (WBCSD Chemicals). Both standards involve the use of values from general databases. For 2022, we calculated Scope 3 emissions of around 92 million metric tons of CO2 equivalents (2021: 101 million metric tons). There was a significant reduction in total emissions along the BASF value chain in 2022 due to lower production volumes.
Our supply chain made the largest contribution to Scope 3 in 2022, with 54 million metric tons of CO2 equivalents (2021: 59 million metric tons). To calculate these upstream greenhouse gas emissions, we used information on the carbon footprint of raw materials, primarily from external databases. We intend to gradually replace this with data from our Supplier CO2 Management Program. In 2022, we were involved in the creation of new Together for Sustainability (TfS) recommendations for determining supply chain emissions to improve reporting transparency and consistency across the industry.
The disposal of our products accounted for 26 million metric tons of CO2 equivalents (2021: 28 million metric tons), the second-largest share of our Scope 3 emissions. This figure is based on assumptions about the disposal of products at the end of the value chain.
Scope 3 emissions along the BASF value chain in 2022a
Million metric tons of CO2 equivalents

Product Carbon Footprints
In 2020, we developed a digital solution to make our product-specific greenhouse gas emissions more transparent and have since determined the carbon footprints of around 45,000 sales products. These Product Carbon Footprints (PCFs) include all greenhouse gas emissions – from raw materials extraction to the finished product leaving the factory gates (“cradle-to-gate”). PCFs provide us with important information for assessing the climate impact of our products and guidance for implementing mitigation measures so that our customers can benefit from reduced carbon emissions in the value chain.
In 2022, we further expanded our portfolio of products with a certified reduced carbon footprint, including engineering plastics and polyurethanes, intermediates and aroma ingredients. We already offer some of our products, such as the intermediates neopentyl glycol and propionic acid, and the isocyanate MDI, with a net zero carbon footprint. These lower PCFs are mostly made possible by the substitution of fossil raw materials. For instance, we use climate-neutral electricity from renewable sources instead of electricity from fossil fuels to produce low-PCF and zero-PCF products. We also use – in whole or in part – renewable, waste-based or recycled raw materials such as palm oil, castor oil, biomethane or pyrolysis oil from plastic waste. These alternative resources have a better carbon footprint than fossil raw materials. The alternative resources are allocated to the end product using the mass balance approach.
The digital methodology we have developed to calculate PCFs meets general life cycle analysis standards such as ISO 14040, ISO 14044 and ISO 14067, as well as the Greenhouse Gas Protocol Product Standard, and has been certified by TÜV Rheinland. We make our automated PCF calculation approach available to interested industry players through partnerships. At the same time, we are involved in various initiatives to drive transparency, harmonization and standardization across the industry. One example is Together for Sustainability. In September 2022, the members of the initiative agreed on a globally uniform guideline for calculating cradle-to-gate PCFs in the chemical industry. This will enable the climate impact of products to be directly compared and evaluated in the future based on a standardized approach. A technical solution for sharing PCF data between companies is under development and should be implemented by the end of 2023.
Harmonizing the methodological approaches used to calculate PCFs also makes an important contribution to the more accurate measurement of the greenhouse gas emissions that arise in the supply chain, for example, during the extraction of raw materials or the manufacture of precursors. These upstream Scope 3 emissions account for the largest share of our corporate carbon footprint.
We currently use industrial averages and values from commercial databases as the basis for calculating upstream Scope 3 emissions. To obtain a more accurate data base and better manage and reduce emissions in the supply chain in the long term, we launched our global Supplier CO2 Management Program in 2021. In a first step, we have since requested the PCFs of our raw materials and support our suppliers in determining these, for example, by sharing our knowledge of valuation and calculation methods with them. Since the start of the program, we have asked more than 1,300 suppliers, covering around 60% of our raw materials-related greenhouse gas emissions. In a second step, we want to work with our suppliers on solutions to reduce product-related emissions and establish the PCF as a criterion for purchasing decisions.
Good to know
Low-carbon and carbon-free processes for climate-smart chemistry
We are also developing completely new technologies for carbon-free and low-carbon production as part of our carbon management (new technologies lever). The main focus here is on basic chemicals, which are often still emissions-intensive to produce. One example is steam reforming, the most common way of obtaining hydrogen. We are already testing an alternative process – methane pyrolysis – in Ludwigshafen, Germany. This is virtually carbon-free if renewable energy is used and extremely energy efficient compared with other methods. Together with Siemens Energy, and depending on funding from the German Federal Ministry for Economic Affairs and Climate Action (BMWK), we are also planning to build a proton exchange membrane (PEM) water electrolyzer in Ludwigshafen with an output of 54 megawatts for carbon-free hydrogen production.
Another example is steam crackers. Steam crackers split petroleum into olefins and aromatics for further processing – both important groups of substances for numerous chemical value chains. The cracking reaction requires high temperatures of around 850 degrees Celsius, which are achieved in conventional plants by burning methane. Heating concepts that use electricity from renewable sources instead could reduce process-related emissions by at least 90% in the future. To test the feasibility of this new process and two different heating concepts, in September 2022 we started construction of a demonstration plant at the Ludwigshafen site in Germany together with our partners SABIC and Linde. The project has been granted €14.8 million from the BMWK under the Decarbonization in Industry funding program. It is scheduled for start-up in 2023.
We also want to break new ground in steam supply, which we need for many chemical processes and have so far mainly produced in our central gas-fired power plants. Here, too, green power-based technologies such as heat pumps or electric boilers offer enormous potential. For instance, we want to recover the thermal energy produced by our production and infrastructure facilities in the future and use it for carbon-optimized steam generation. In this context, we initiated a feasibility study with MAN Energy Solutions in July 2022 on the construction of an industrial-scale heat pump at the Ludwigshafen site in Germany.
Another focus area is carbon capture and storage (CCS). For example, we are part of an industrial CCS project at the Antwerp site in Belgium (Kairos@C) as the first phase of the Antwerp@C project, which will enable BASF to avoid the emission of up to 1 million metric tons of CO2 into the atmosphere every year from production.