Functional Materials & Solutions
2nd Quarter 2018
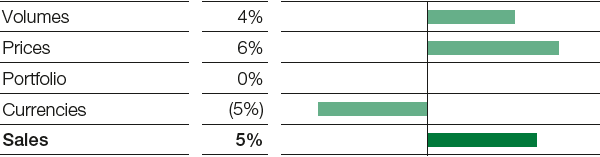
In the Functional Materials & Solutions segment, we recorded slight sales growth compared with the prior-year quarter on the back of higher prices and increased sales volumes. Sales were negatively impacted by currency effects, primarily relating to the U.S. dollar. Income from operations (EBIT) before special items was considerably below the figure for the second quarter of 2017, primarily as a result of higher fixed costs and lower margins due to the increase in raw materials prices.
Factors influencing sales, Functional Materials & Solutions
2nd quarter 2018
Catalysts
Sales in the Catalysts division grew considerably year on year due to higher prices and volumes. The price increases were mainly a consequence of higher precious metal prices. Volumes grew in precious metal trading and in chemical and refining catalysts as well as in battery materials. Currency effects had a negative impact on sales. In precious metal trading, sales increased to €801 million (second quarter of 2017: €651 million) due to the previously mentioned higher prices and volumes. EBIT before special items decreased considerably, mainly due to higher fixed costs. Fixed costs increased due among other factors to the startup of new plants.
Construction Chemicals
The Construction Chemicals division recorded a slight increase in sales compared with the prior-year period. This was attributable to higher volumes, as well as the acquisition of the waterproofing systems supplier Grupo Thermotek, Monterrey, Mexico, in September 2017. Negative currency effects had an offsetting effect; prices were on a level with the prior-year quarter. In Europe, volumes growth in the construction systems business in particular resulted in considerably higher sales. In North America, sales rose considerably due to the acquisition of Thermotek and higher sales volumes. Despite higher volumes, sales declined in Asia and in the region South America, Africa, Middle East, mainly as a result of negative currency effects. EBIT before special items was up slightly on the prior-year figure, largely because of lower fixed costs.
Coatings
Sales in the Coatings division were on a level with the second quarter of 2017. Negative currency effects were offset by a slight increase in sales volumes and slightly higher prices. We recorded volumes growth, particularly for automotive OEM coatings, automotive refinish coatings and surface treatments. Volumes in the decorative paints business decreased significantly due to the effects of the truck drivers’ strike in Brazil, which lasted almost two weeks. EBIT before special items declined considerably year on year due to higher fixed costs and the increase in raw materials prices.
Performance Materials
In the Performance Materials division, sales slightly exceeded the figure for the prior-year quarter, primarily due to higher sales prices. Sales prices were increased in the polyurethane systems and engineering plastics businesses in particular. However, this did not match the rise in raw materials prices. Sales volumes also grew, driven by the business with the automotive industry and demand in the consumer goods industry, especially for engineering plastics and thermoplastic polyurethanes. Currency effects had a negative impact. EBIT before special items declined considerably as against the second quarter of 2017. This was attributable to higher fixed costs, due among other factors to the startup of new plants, as well as lower margins as a result of the increase in raw materials prices.
|
|
2nd quarter |
1st half |
||||||||
|---|---|---|---|---|---|---|---|---|---|---|---|
|
|
2018 |
2017 |
Change in % |
2018 |
2017 |
Change in % |
||||
|
|||||||||||
Sales to third parties |
|
5,540 |
5,261 |
5 |
10,679 |
10,459 |
2 |
||||
of which Catalysts |
|
1,884 |
1,674 |
13 |
3,620 |
3,363 |
8 |
||||
Construction Chemicals |
|
664 |
646 |
3 |
1,208 |
1,206 |
0 |
||||
Coatings |
|
995 |
998 |
0 |
1,935 |
1,997 |
(3) |
||||
Performance Materials |
|
1,997 |
1,943 |
3 |
3,916 |
3,893 |
1 |
||||
Income from operations before depreciation and amortization (EBITDA) |
|
494 |
584 |
(15) |
986 |
1,272 |
(22) |
||||
Amortization and depreciation1 |
|
168 |
157 |
7 |
335 |
324 |
3 |
||||
Income from operations (EBIT) |
|
326 |
427 |
(24) |
651 |
948 |
(31) |
||||
Special items |
|
(12) |
5 |
. |
(20) |
(5) |
. |
||||
EBIT before special items |
|
338 |
422 |
(20) |
671 |
953 |
(30) |
||||
Assets (June 30) |
|
17,533 |
17,334 |
1 |
17,533 |
17,334 |
1 |
||||
Investments including acquisitions2 |
|
166 |
194 |
(14) |
294 |
357 |
(18) |
||||
Research and development expenses |
|
104 |
110 |
(5) |
208 |
209 |
0 |
||||