Business review by segment
Overview
|
Segment overview (in million €) |
|||||||||||
|
|
|
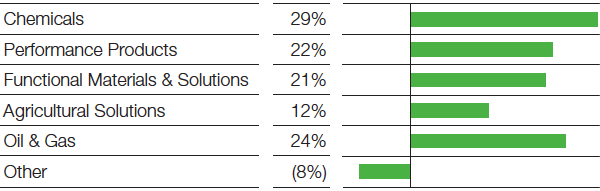
Sales |
Income from operations before depreciation and amortization (EBITDA) |
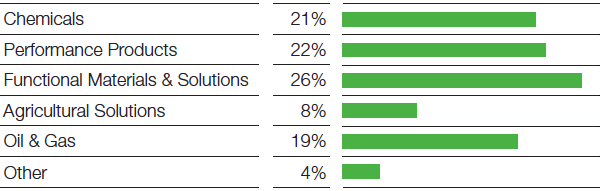
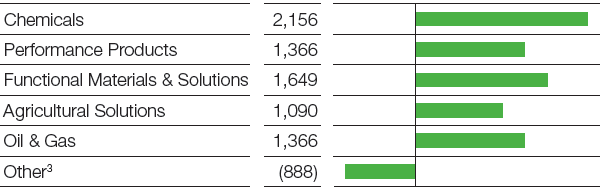
Income from operations (EBIT) before special items | |||||||
|---|---|---|---|---|---|---|---|---|---|---|---|
|
|
|
2015 |
2014 |
2015 |
2014 |
2015 |
2014 | ||||
|
|||||||||||
|
Chemicals |
|
14,670 |
16,968 |
3,090 |
3,212 |
2,156 |
2,367 |
||||
|
Performance Products |
|
15,648 |
15,433 |
2,289 |
2,232 |
1,366 |
1,455 |
||||
|
Functional Materials & Solutions |
|
18,523 |
17,725 |
2,228 |
1,678 |
1,649 |
1,197 |
||||
|
Agricultural Solutions |
|
5,820 |
5,446 |
1,321 |
1,297 |
1,090 |
1,109 |
||||
|
Oil & Gas |
|
12,998 |
15,145 |
2,587 |
2,626 |
1,366 |
1,795 |
||||
|
Other1 |
|
2,790 |
3,609 |
(866) |
(2) |
(888) |
(566) |
||||
|
|
|
70,449 |
74,326 |
10,649 |
11,043 |
6,739 |
7,357 |
||||
|
|
|
|
|
|
|
|
|
||||
|
|
|
Income from operations (EBIT) |
Assets |
Investments2 | |||||||
|
|
|
2015 |
2014 |
2015 |
2014 |
2015 |
2014 | ||||
|
Chemicals |
|
2,131 |
2,396 |
12,823 |
12,498 |
1,859 |
2,085 |
||||
|
Performance Products |
|
1,340 |
1,417 |
14,232 |
14,502 |
964 |
849 |
||||
|
Functional Materials & Solutions |
|
1,607 |
1,150 |
13,341 |
12,987 |
854 |
650 |
||||
|
Agricultural Solutions |
|
1,083 |
1,108 |
8,435 |
7,857 |
402 |
391 |
||||
|
Oil & Gas |
|
1,072 |
1,688 |
12,373 |
13,686 |
1,823 |
3,162 |
||||
|
Other1 |
|
(985) |
(133) |
9,632 |
9,829 |
111 |
148 |
||||
|
|
|
6,248 |
7,626 |
70,836 |
71,359 |
6,013 |
7,285 |
||||